Pearl River Delta Sea Level Rise Animation

Pearl River Delta Flood Animation from Luca Zoid on Vimeo.

Summary:
This short animation shows possible flooding caused by sea level rise in the Pearl River Delta region of China. Sea level rise here goes from 1 metre (likely by 2100) to 60m (projected maximum assuming the melting of all polar ice).

Video Credits:
Graphic Design and animation by John Causley from Big Fag Press.

Produced as part of Lucas Ihlein’s Guangzhou Delta Haiku project, exhibited at Observation Society in Guangzhou, June-July 2016.

Guangzhou Delta Haiku – exhibition text at Observation Society

pearl river delta region - showing current sea level

Pearl River Delta region. Light blue colour indicates current land below sea level.

Silty river delta,
Fishing, farming, trading –
Everyday life.

Of all the world’s cities, the great Guangzhou “megalopolis” is now considered the single place most likely to suffer catastrophic damage from rising sea-levels. The maps shown here indicate some possible future scenarios for the Pearl River Delta. Much of the land in the Delta is already below sea level, so industry and housing are vulnerable to flooding:

Factories, shipping,
“Special Economic Zone” –
Everyday life.

Sea level rise is influenced by a wide range of factors. The most obvious causes are associated with global warming: the thermal expansion of the oceans, and the melting of glaciers and Antarctic ice sheets. More complex local factors include tidal variations, warm and cool ocean currents, the building of sea-walls to hold back the water, and the damming of rivers further upstream.

pearl river delta region - showing one metre sea level rise

Pearl River Delta region – light blue colour indicates potential flooding caused by a one metre sea level rise.

The screenprinted maps shown here cannot show the full complexity of this situation. Rather, they employ “bathtub modelling” – a simple way of showing what might happen if seawaters were to creep up onto the land in a uniform way.

Although it is nearly impossible to predict the local extent of sea level rise with any precision, the Intergovernmental Panel on Climate Change suggests that a global sea level rise of 98cm by the year 2100 is very likely. This corresponds roughly to the “one metre” maps presented in this exhibition. A “five metre” map is also shown – which is entirely possible if polar ice deposit melting continues to accelerate.

pearl river delta region - showing 5 metre sea level rise

Pearl River Delta region – light blue colour indicates potential flooding caused by a five metre sea level rise.

Massive migration.
“Mega-projects”. Modernisation:
Everyday life.

The animated map depicts a massive “60 metre” sea level rise, which is a possible scenario if all the world’s polar ice was to melt.

Pearl River Delta Flood Animation from Luca Zoid on Vimeo.

The prosperity of the Delta has always been based on water. And the future of Guangzhou is going to be increasingly watery:

How will the city evolve?
What kinds of decisions will the city make to survive over the next hundred years? What does “survival” even mean?
And what do the people who live here think about all this?

Habitat, transport,
Sustenance, trash disposal:
Everyday life.

guangzhou haizhu area - current sea level

Haizhu area of Guangzhou – this map shows current river arrangements in this heavily populated zone.

guangzhou haizhu area - showing one metre sea level rise

Haizhu area of Guangzhou – light blue colour on this map indicates possible effect of one metre sea level rise.

This investigation is ongoing, and your correspondence is welcome.
Email: lucas@guangzhou-delta-haiku.net

Daoshan Dude

English Translation of lyrics from Daoshan Dude, by Wu Tiao Ren

Daoshan dude, Why are you wearing broken shoes?
Daoshan dude, Why don’t you have your hair cut?
Daoshan dude, Why are you still riding the worn out bike?
Cocky.
You are cocky. You are cocky. You are cocky.

It’s going to rain.
My mum is waiting for me to have supper.
But what can I do?
I’m in a watch house.
My mum said “come home and eat”
It’s all my fault
I am cocky.
You are cocky.

Back in the Delta

I’ve returned to Guangzhou for the second time. This time working towards an exhibition called Sea Pearl White Cloud at Observation Society, alongside Trevor Yeung.

Between trips to Guangzhou, I’ve been working with John Causley, a graphic designer from Big Fag Press. We’ve been using map-making as a way of trying to understand the problem (or is it?) of sea level rise, and its future impact on the Pearl River Delta.

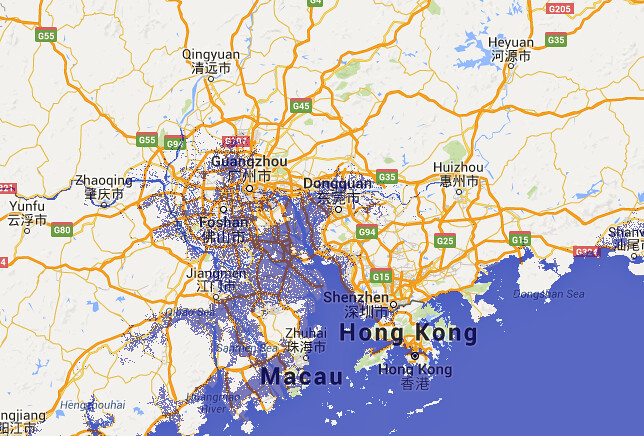
Rummaging around, we found this great little website, which crunches topographic data and allows you to visualise rising sea level rises as an overlay on top of google maps. You can toggle the amount of rise in metres. For example, here’s Guangzhou with a one metre rise:

guangzhou sea level rise visualisation

John set to work trying to extract the base map from the flood overlay, so that we might have something to play with for making a print. Some of what he was able to do was elegant (switching off various bits of data in google maps in order to capture the mapping info) and some involved more brute force (doing a screenshot of the flood map layer and then photoshopping out irrelevant info).

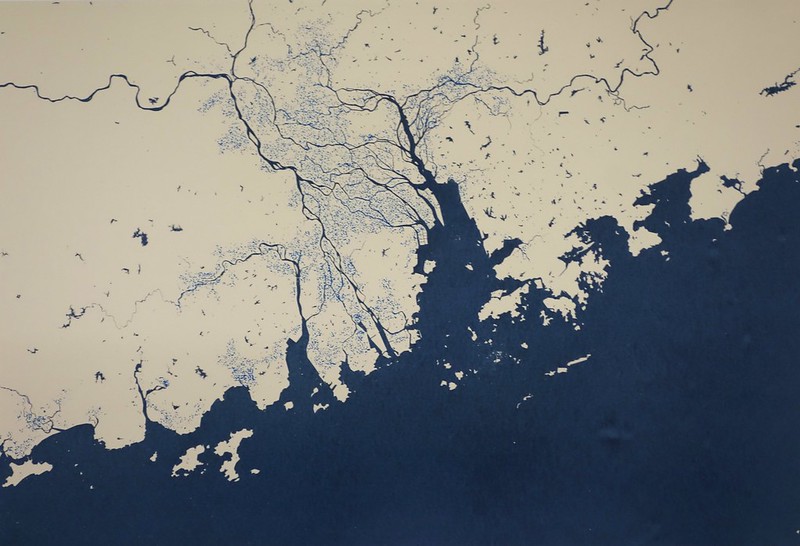
Here’s where we got to:

guangzhou base map
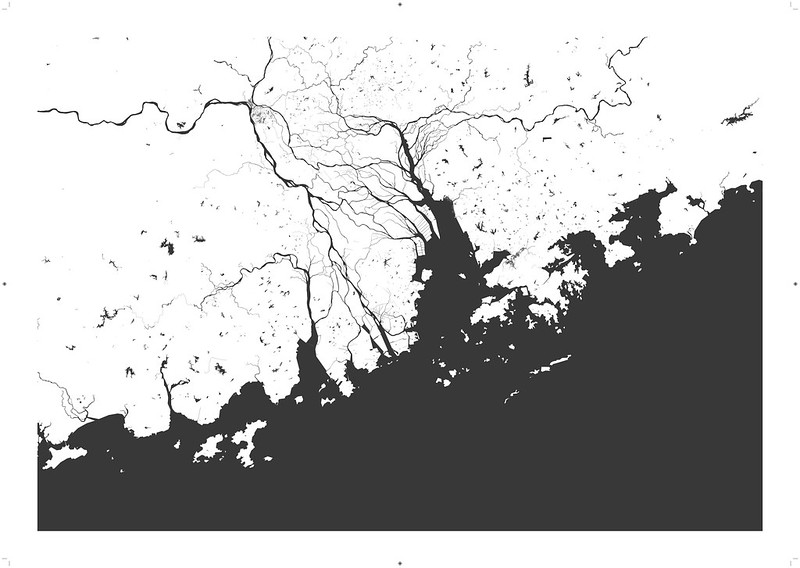
[Pearl River Delta base map]

guangzhou map one metre sea level rise flood scenario
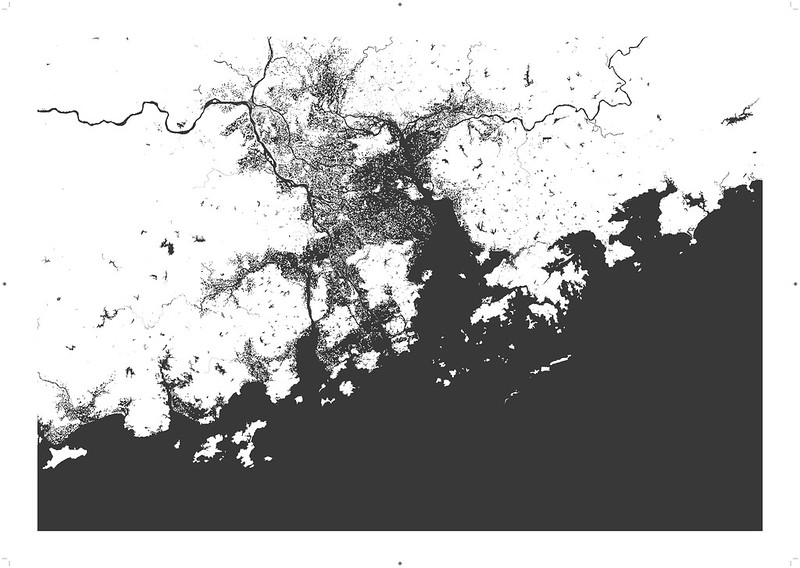
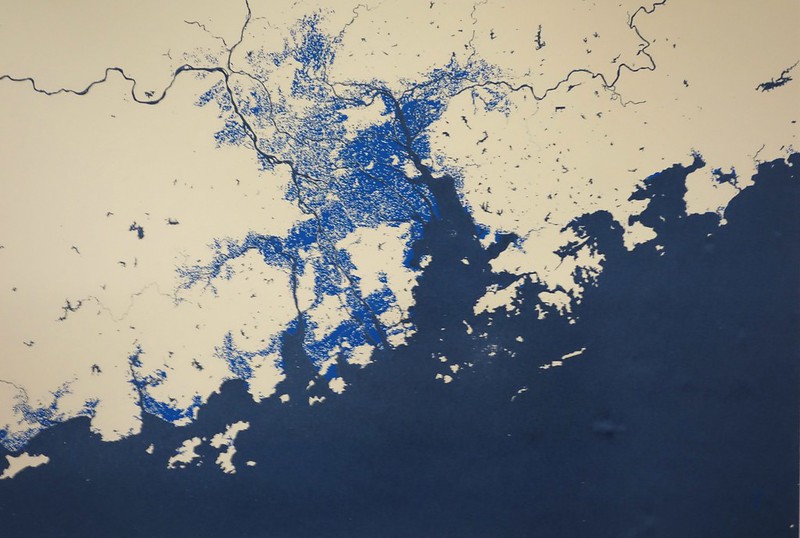
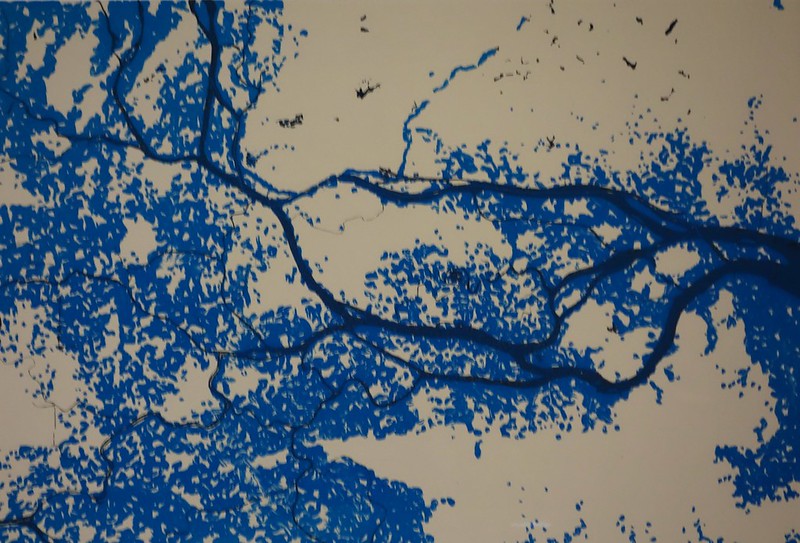
[Base map with 1 metre sea level rise scenario overlay]

When we printed these maps out as good quality inkjet drafts back in Australia, we were struck by a few issues:

The map certainly has a dramatic effect. One metre of sea level rise seems to obliterate much of the city. I was thinking that it might be interesting to have these maps printed to use as a point of discussion with Guangzhou folks.

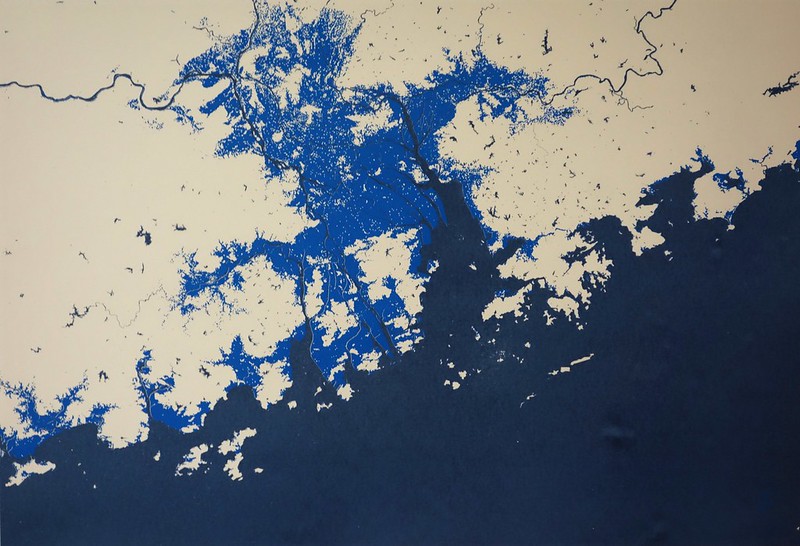
However, it would be good to be able to zoom in closer. Someone living in Haizhu district, for example, might want to know what is going to happen in their local neighbourhood. When we tried the zoom, focusing on Haizhu, this is what emerged:
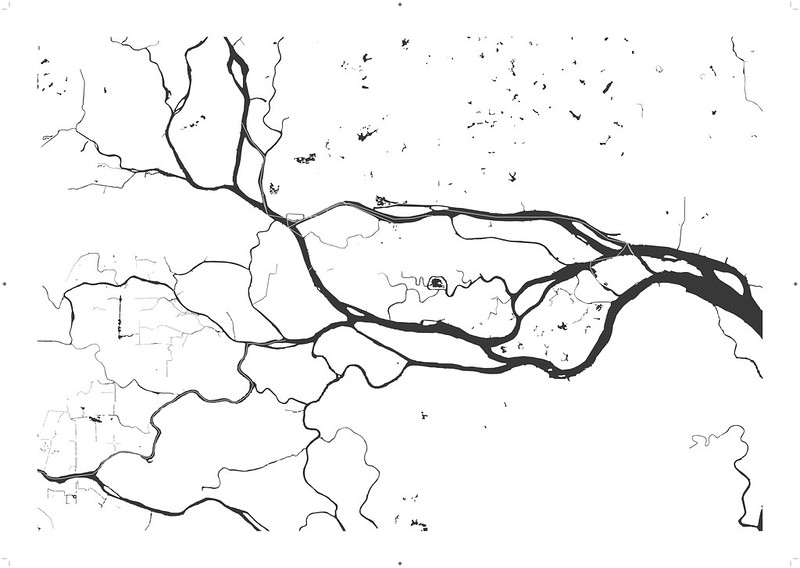
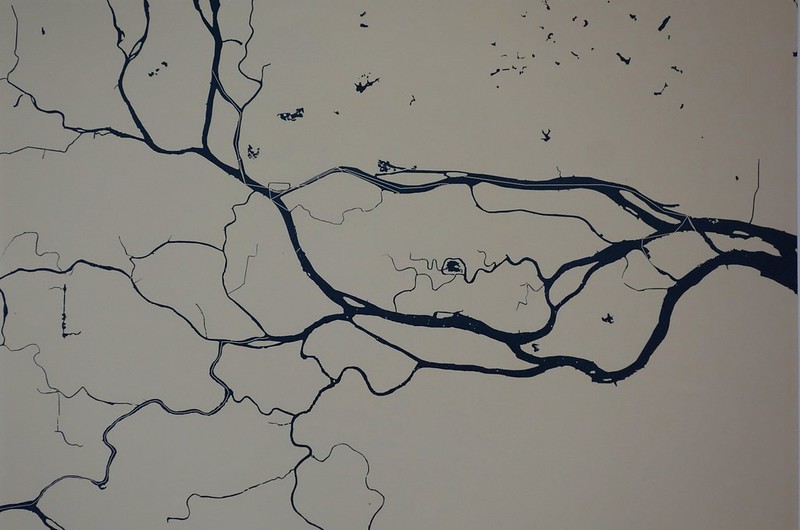
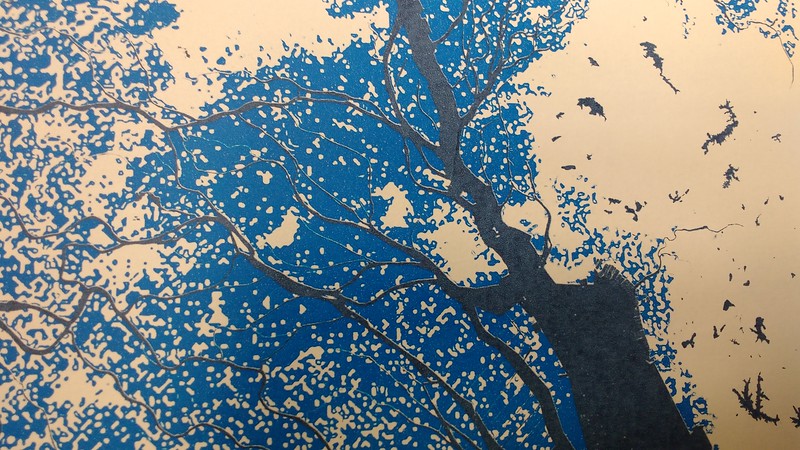
haizhu base map
[Haizhu base map]

haizhu 1m sea level rise scenario
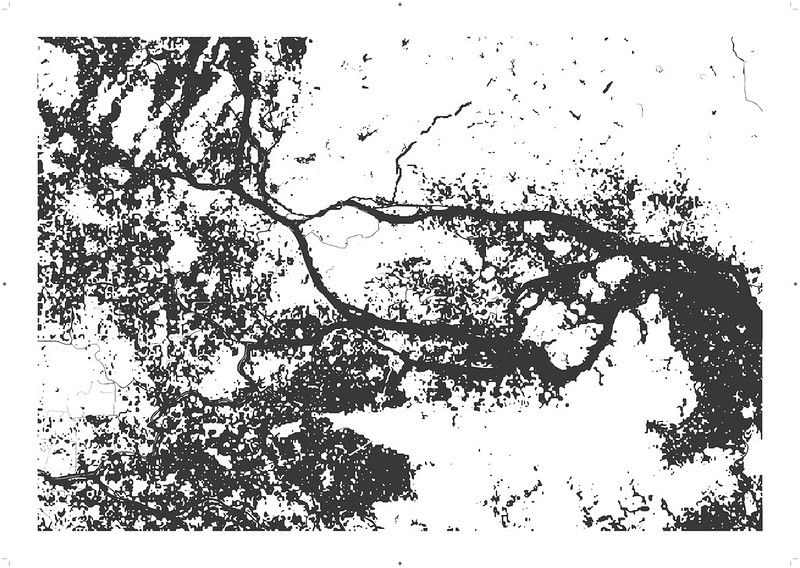
[Haizhu base map with 1 metre sea level rise scenario overlay]

This looks good – but we are acutely aware that this data is not really “zoomable” to this extent. At this level of enlargement, photoshop begins to invent information. Is this a problem?

I talked to Clive Schofield, a friend from University of Wollongong who is a “bit of an expert” on geography and politics. What I really wanted to know was, how long will it take for the 1metre sea level rise scenario to play out? When could Guangzhou expect to see this happen?

Clive warned me that the sea level rise maps we’ve been making are based on a the simplistic “bathtub modelling” system, which doesn’t take into account a whole range of factors. In a follow-up email, Clive writes:

I am afraid that what you are asking for doesn’t really exist per se…It is a fiendishly difficult and complex business to try to disentangle causes of sea level rise and particularly to distinguish what proportion of sea level rise is attributable to a particular factor.

His email continues:

Not only do bathtub modelling approaches generally not take into account regional variations in sea level but they also don’t accommodate how particular coast and coastal ecosystems interact with sea level. Such approaches generally treat coasts as static landforms, therefore imagining that as sea level rises it simply ‘marches up the contours’. While that might arguably be true for rocky coastlines it is a flawed approach for other coastlines including the low-lying generally soft sediment ones you are considering. It is important to realise that not only is sea level rise likely to be highly uneven spatially, but that its impacts on diverse coastal environments will be similarly varied.

Clive suggested that one of the factors affecting the Pearl River Delta might be that if there is damming of the water further upstream, then the delivery of sediments to the delta which traditionally built up the land won’t be happening. In this case, independent of any sea-level rise, the delta lands may be in fact subsiding. This paper seems to support that idea.

It’s all a bit overwhelming. Even though I’ve learned a fair bit in the last few weeks about all this stuff, not-knowing seems to be the main thing here. It makes me feel … how? Dissatisfied? A bit sick in the stomach, to be honest.

* * *

Postscript – I sent this post to The Abovementioned Clive. In his reply, he suggested that I could try to be a bit more upbeat about all of this. He writes:

The lesson from certain coastal ecosystems is that they are able to autonomously adapt to changing sea levels… if we allow them to. That is where management of coastal land and sea scapes becomes crucial.

The Dongguan Moon

The Dongguan moon is like a tiny boat
Carrying a flock of affectionate swordsmen
Wandering about across the gentle river

This haiku-ish text is from a very short song by Wu Tiao Ren, a Guangzhou band. With any luck, today I’ll get to meet the band and talk about a possible collaboration.

wu tiao ren